VibeScaler turns an ordinary printed pattern into a calibration standard. You photograph the pattern through your microscope, the app measures how many pixels correspond to a known real-world distance, and from then on it can draw a scale bar onto any image taken with that same camera and setup.
It is built for hobbyist and educational microscopy. It is accurate enough for most amateur work, but it is not a traceable scientific instrument, so the scale bars it places are labelled as approximate — for example, “~100 µm”.
Download
VibeScaler is free and runs on Windows and macOS. It needs no installation — download the file for your system and run it.
Windows (64-bit) — 93 MB macOS (Apple Silicon) — 75.7 MB
On an Intel Mac, run the Apple Silicon build through Rosetta 2. Both macOS builds require macOS 11 (Big Sur) or later.
System requirements
VibeScaler needs no installation: Python and every library it uses are bundled into the application. The application can run straight from any folder — including a USB stick or an external drive.
Note on first time launch:
Windows — The first time you run VibeScaler, Windows may say it doesn't recognize the app. That is normal. Click "More info", then "Run anyway".
macOS — The first time you open VibeScaler, macOS may say it can't be verified. That is normal. Click "Done", then open System Settings → Privacy & Security, scroll to the bottom, and click "Open Anyway".
| Windows | Windows 10 or 11 (64-bit). Previous Windows versions are not supported |
|---|---|
| macOS | macOS 11 (Big Sur) or later — Apple Silicon natively; Intel via Rosetta 2 |
| Size | 93 MB (Windows) and 75.7 MB (macOS) |
| Camera | Any microscope camera (even your phone's one!) that saves still images |
| Image formats | JPEG, PNG, TIFF, and BMP |
Windows 8, 8.1, and 7 are not supported: Qt 6, the toolkit VibeScaler is built on, requires Windows 10 (version 1607) or newer.
Step-by-step
You calibrate once for a given camera and zoom, then add scale bars to as many images as you like (one by one).
The main window
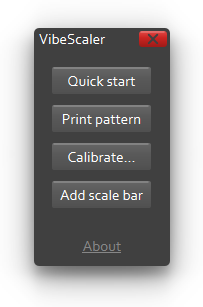
Launch VibeScaler by double-clicking its icon. The main window offers five choices:
Quick start — a short overview of the whole process. Print pattern — opens the calibration pattern as a PDF to print. Calibrate… — measures the pixel scale from your photographs of the pattern. Add scale bar — draws a scale bar on an image using a saved calibration. About — version and author information.
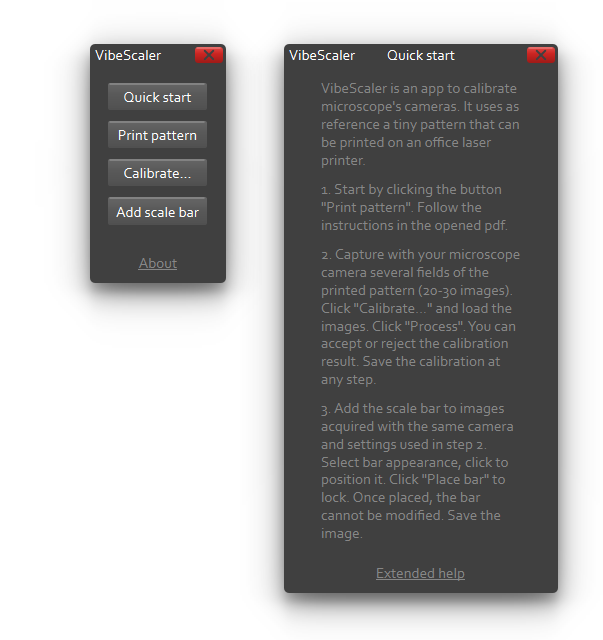
Quick start sums up the three stages — print the pattern, calibrate, add a scale bar — on a single screen. For the full detail you are reading here, and the math behind the calibration, follow its Extended help link, which opens this document.
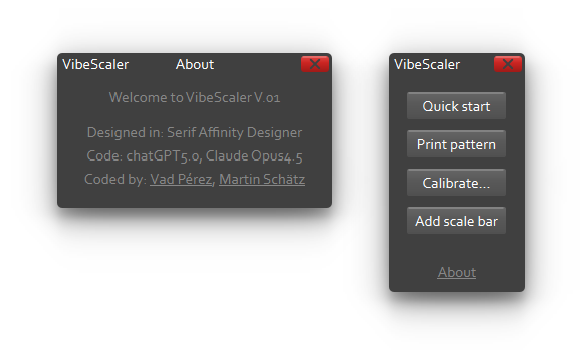
About shows the version and credits the authors.
With the app open, the full workflow is:
-
Print the pattern.
Click Print pattern. The calibration pattern opens as a PDF in your computer's default PDF viewer. Print it at 100% scale, with “fit to page” turned off, on a laser printer using plain white office paper (80–100 g/m²); choose the A4 or US Letter page to match your printer. The pattern is two black lines, each 0.2 mm wide, separated by a 0.2 mm gap.
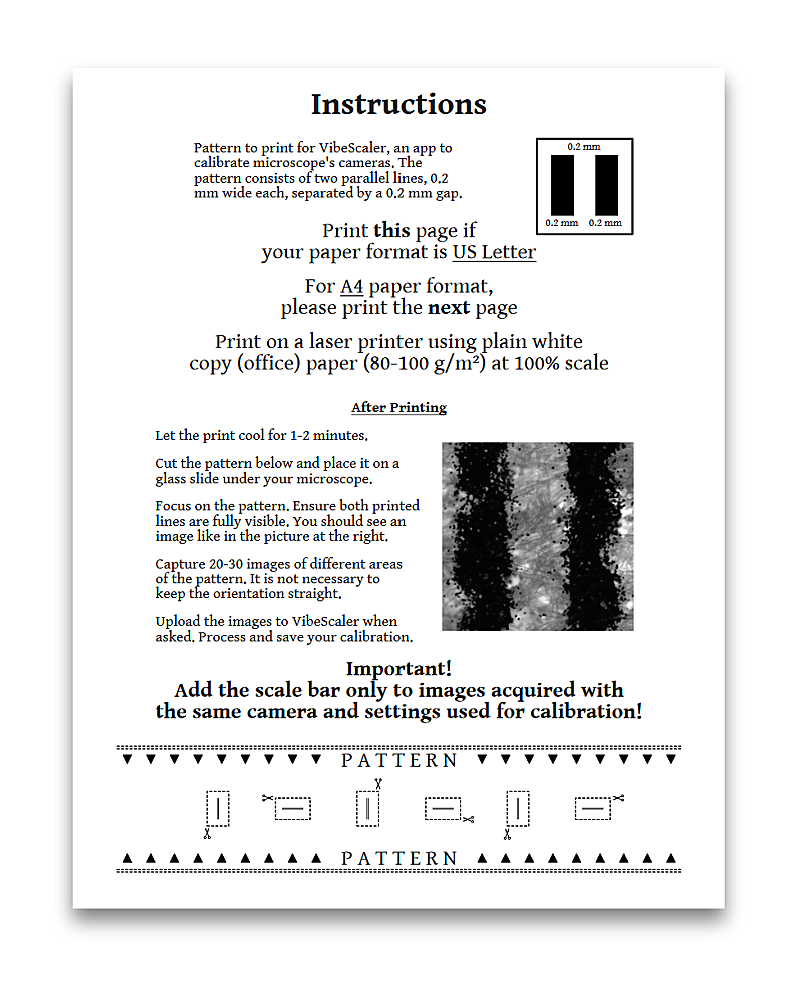
The pattern opens as a two-page PDF for printing. Choose the appropriate page format to print. -
Cut out the pattern.
Let the print cool for a minute or two, since warm laser toner can smear, then cut out the pattern. It sits at the bottom of the printed page, beneath the instructions.
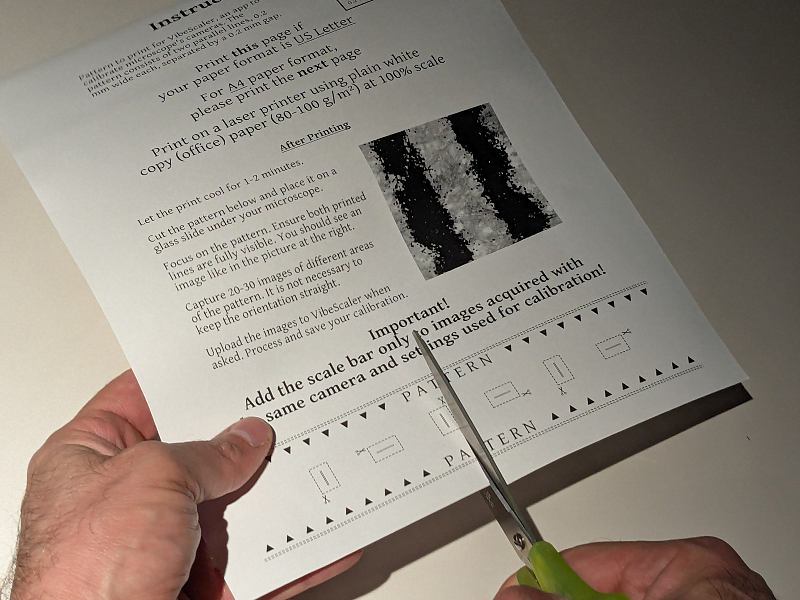
The pattern is at the bottom of the printed page. -
Place it on a glass slide.
Lay the cut pattern flat on a clean microscope slide and set it on the stage under your objective.
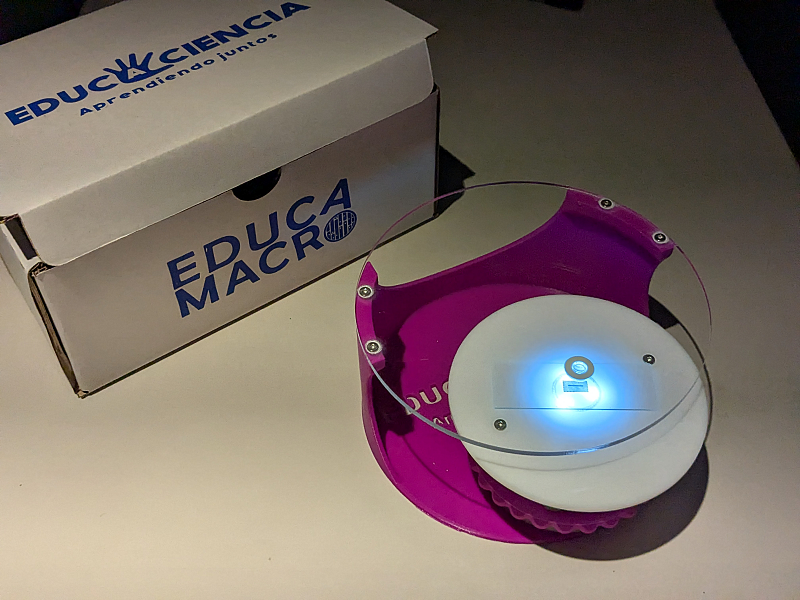
The pattern on a slide. Shown is the 3D-printed Educamacro from Educaciencia. -
Photograph the pattern through your microscope.
Focus until both lines are sharp and fully inside the frame, then capture 20–30 images of different areas of the pattern. The lines do not need to be straight; tilted or diagonal frames are fine, because the app finds the angle automatically. Avoid strong glare that washes out the toner.
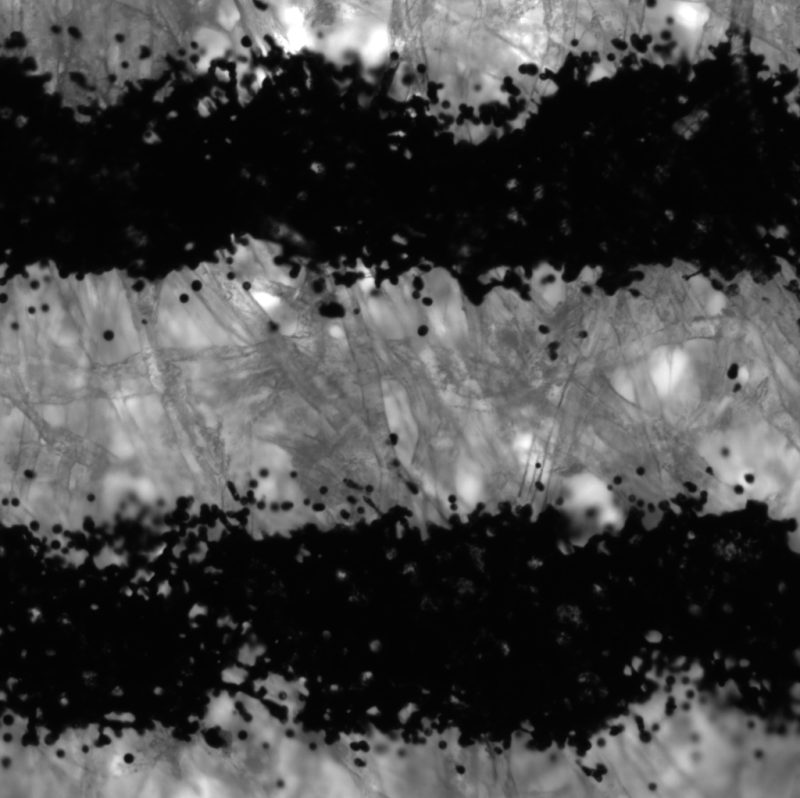
The pattern seen through the microscope. -
Calibrate.
From the main window choose Calibrate…, add your photographs, and click Process. VibeScaler finds the two lines in each frame, marks them, and reports the distance between them in pixels (for example, “Distance: 678.00 px”). Review each result and Accept or Skip it; the counter (such as “Revised: 5/23”) tracks your progress. When you have reviewed the frames, click Save calibration… — you can save at any step. The calibration is written as a JSON file, and the app shows its details and the number of images it was built from.
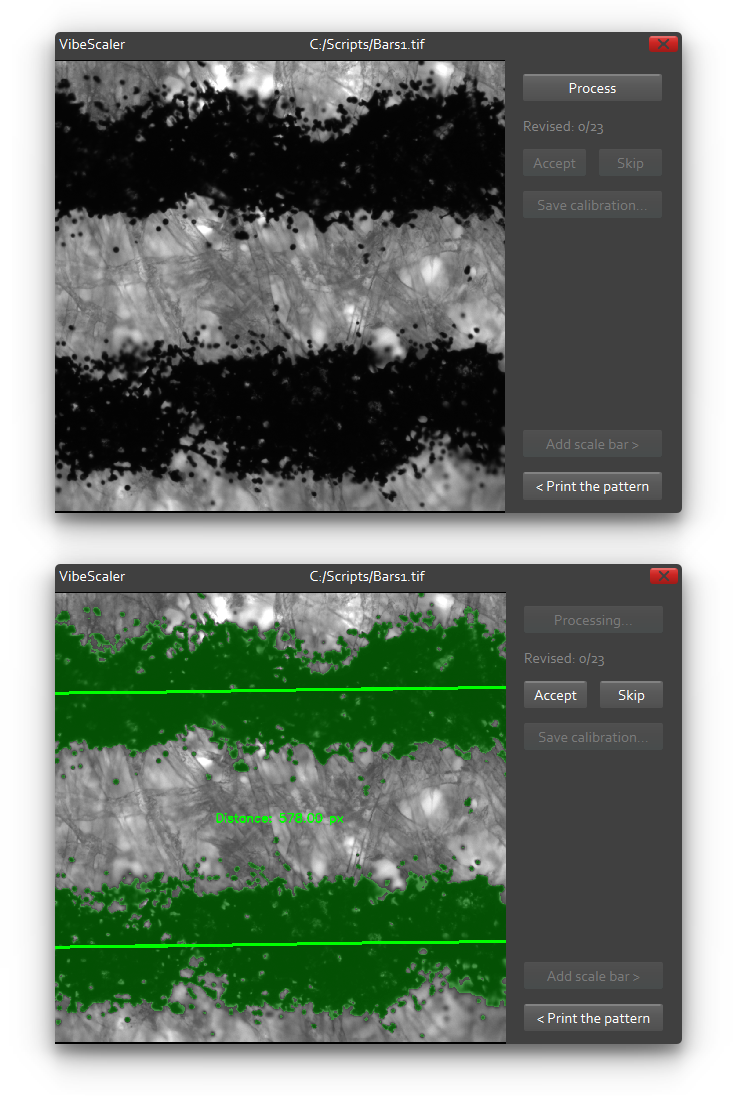
Calibrating: review each frame, then save. -
Add a scale bar.
From the main window choose Add scale bar and open the image you want to annotate — it must come from the same camera and zoom as the calibration. Load the saved calibration; the button confirms “Calibration OK”. Set the bar's appearance: its length in micrometres, its thickness in points, its colour (white, grey, or black), its orientation (horizontal or vertical), and, optionally, a text label with its own font size. Click on the image to move the bar where you want it. When you are satisfied, click Place bar to lock it in — after this the bar's properties can no longer be changed. Finally, use Save as… to save a copy of the image with the scale bar.
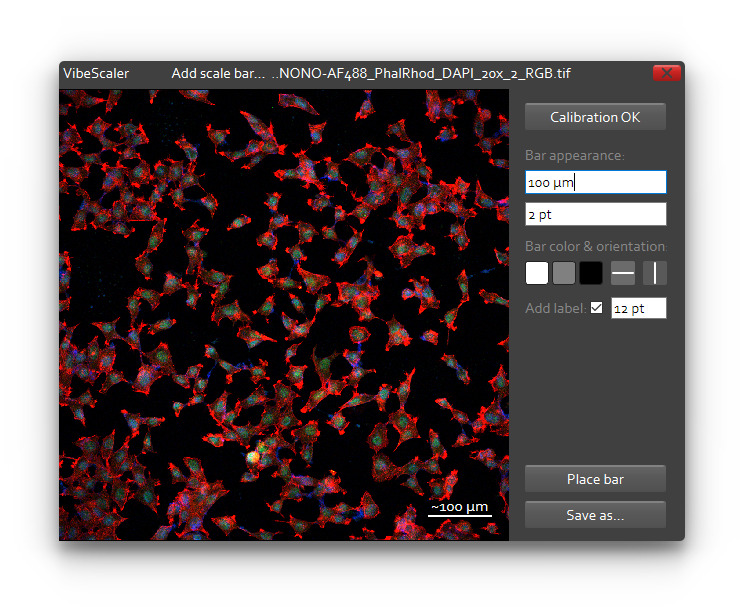
Adding a scale bar.
Troubleshooting
Almost every problem comes from the capture step. If calibration finds no lines or fails, the lines are usually out of focus, only one line is in the frame, or glare is washing out the toner; refocus so both lines are sharp and complete, reduce the glare, and recapture.
If results vary a lot between frames, focus or framing drifted between shots — keep focus steady and the pattern flat, and capturing more frames lets the average settle.
If a scale bar looks too big or too small, the image was almost certainly taken with a different camera or zoom than the calibration, so re-calibrate for that setup.
How VibeScaler is built
VibeScaler is a Python application that leans on a few well-known, open-source libraries, each doing a specific job. Knowing what they are also explains some of its behaviour — for instance, why it needs Windows 10 or newer.
| Graphical interface | PySide6, the official Python bindings for the Qt 6 toolkit — every window, button, and dialog. Qt 6 is also the reason Windows 10 or newer is required. |
|---|---|
| Image processing | OpenCV — reading each frame, isolating the printed lines, finding their orientation and centroids, measuring the distance, and drawing both the calibration overlay and the final scale bar. |
| Numerical work | NumPy — the array arithmetic behind the measurements, the averaging, and the consistency statistics. |
| Image loading & saving | Pillow — opening your photographs and writing the annotated result. |
| Packaging | PyInstaller bundles Python and all of the above into a single self-contained application that needs no installation, so it can run from any folder or external drive. |
The math behind calibration
Calibration reduces to one idea: find the centroids of the two printed lines, measure the distance between them in pixels, and divide the known real distance (set in the design) by it. Internally, the analysis routine processes each frame and returns the centroid distance in pixels (it calls this distance_px) together with the rotation angle it applied (best_angle). Here is what happens, step by step.
-
Threshold — separate the lines from the paper
The frame is converted to greyscale intensity and turned into a black-and-white mask, so the dark toner lines become the foreground. With a threshold :
-
Find the orientation — best_angle
The two bars may sit at any angle. The routine searches for the rotation that lines them up cleanly and records it as (best_angle); the mask is rotated by so the bars become parallel to an axis. This is why a tilted frame works just as well.
-
Centroids of the two lines
Each line is a set of foreground pixels (with ). Its centroid is the mean position, weighted by the pixel value (1 for the binary mask, or darkness for a greyscale line):
-
Distance between centroids — distance_px
The straight-line distance between the two centroids, in pixels:
-
Scale of this frame — um_per_px
The centroids are 400 µm apart in the real world (the constant the app calls , built from ½ of the first line + the gap + ½ of the second line). So the scale of this frame, in micrometres per pixel, is:
-
Combine the accepted frames
The calibration you save is the average of the scales from the frames you accepted. The spread of those values tells you how consistent your captures were — a small spread means a reliable calibration:
-
Draw a scale bar
To draw a bar standing for a physical length , the app converts it back into pixels using the saved scale:
Disclaimer
VibeScaler is provided free of charge and “as is”, with no warranty of any kind, express or implied. You use it entirely at your own risk and are solely responsible for any measurements or results you obtain with it. To the maximum extent permitted by law, the authors accept no liability for any loss or damage arising from its use.
You may use and share VibeScaler freely, provided it is passed on unmodified and in its complete original form. It may not be modified, sold, or reverse-engineered.
VibeScaler is a tool for hobbyist and educational microscopy, not a calibrated scientific instrument; treat its measurements as approximate.
Copyright & contact
Feedback is always welcome. So far VibeScaler has been tested with a pattern printed on a Canon MF272dw laser printer and a calibration carried out on a Nikon Eclipse Ti microscope; other printer and microscope models remain to be tested. If you try it with different equipment, please email the authors with example images — this helps widen the tested database and may allow correction factors in future versions.